The Main Window
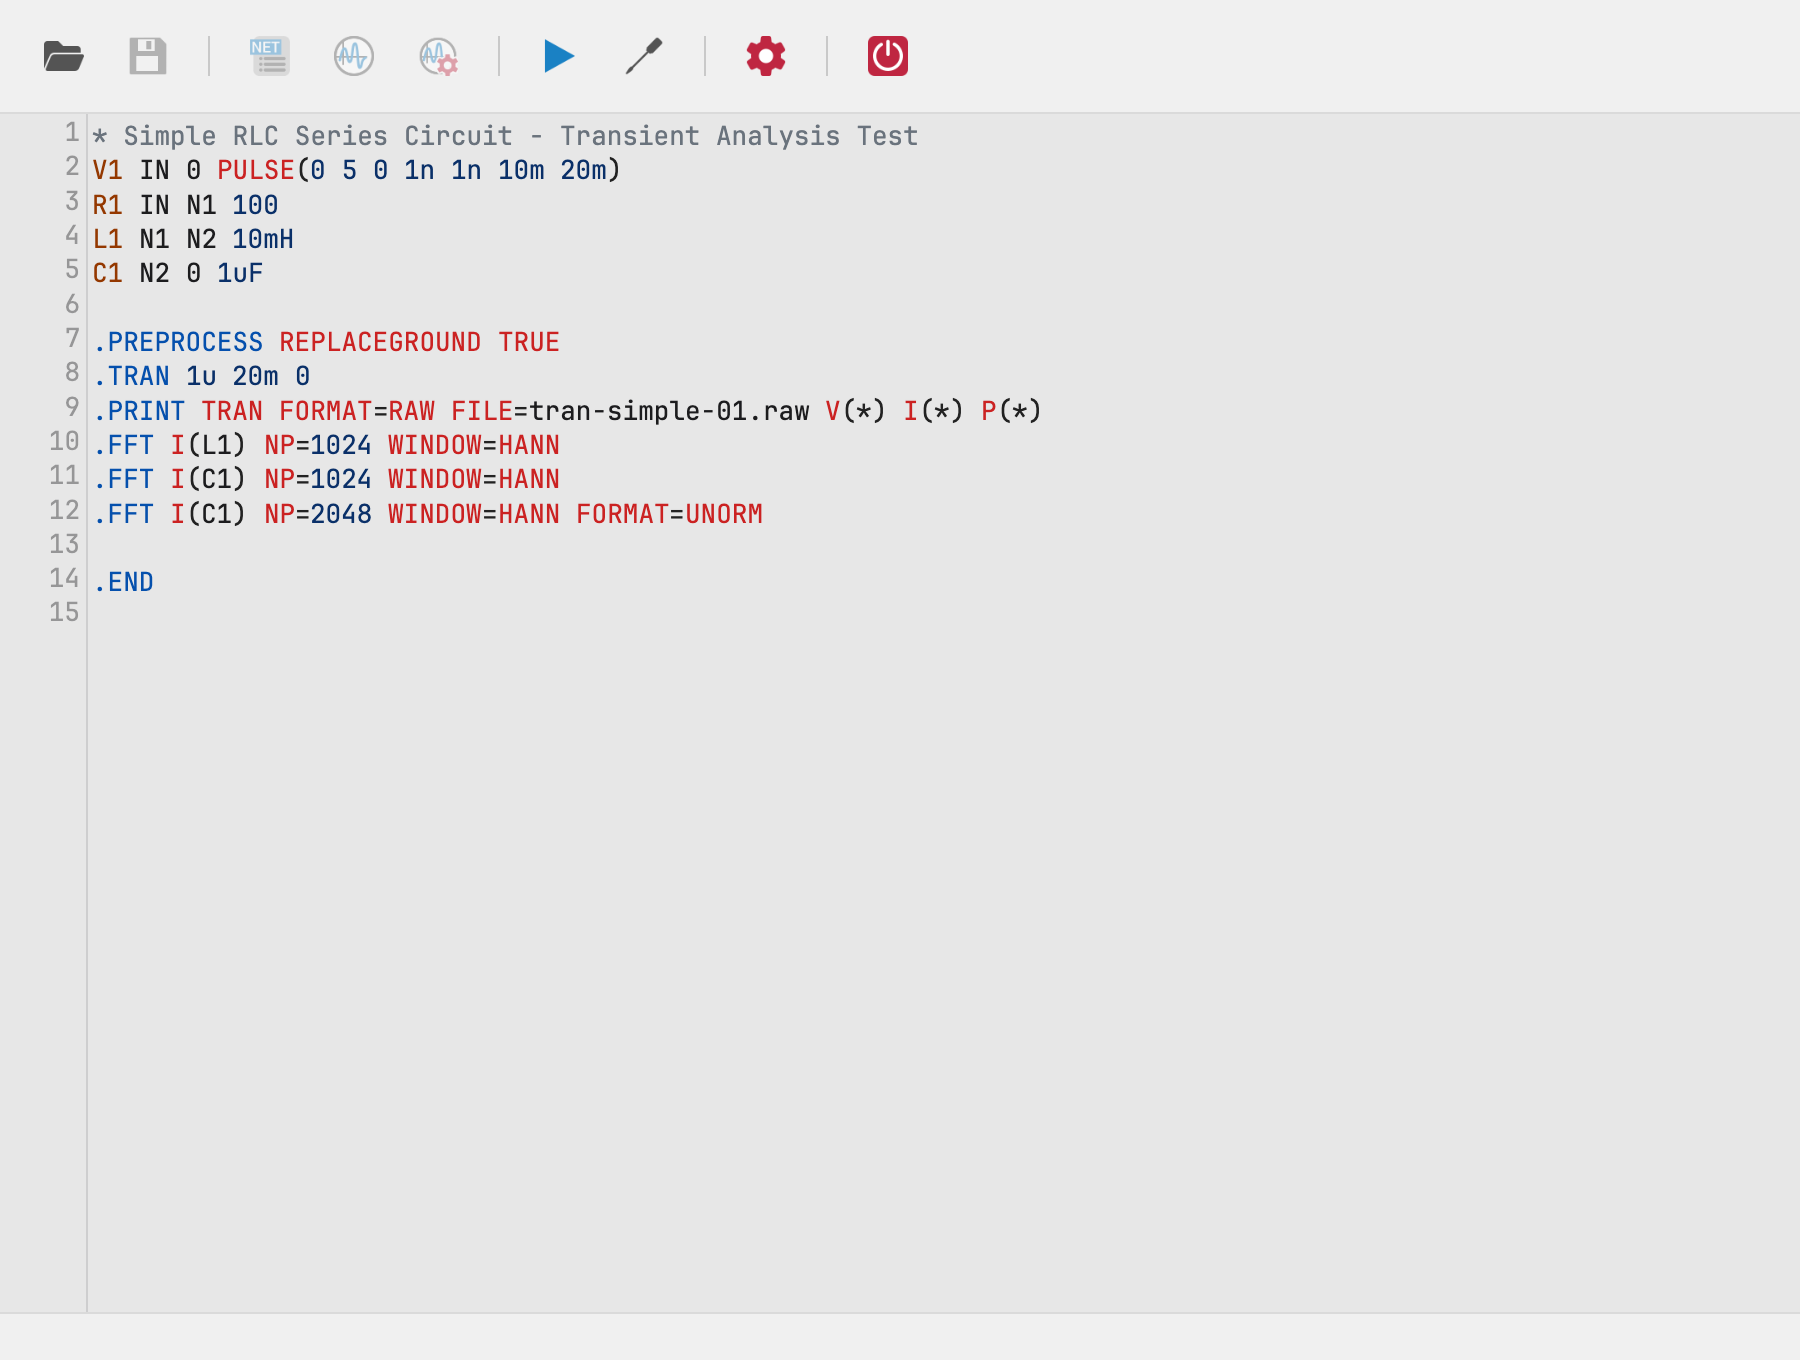
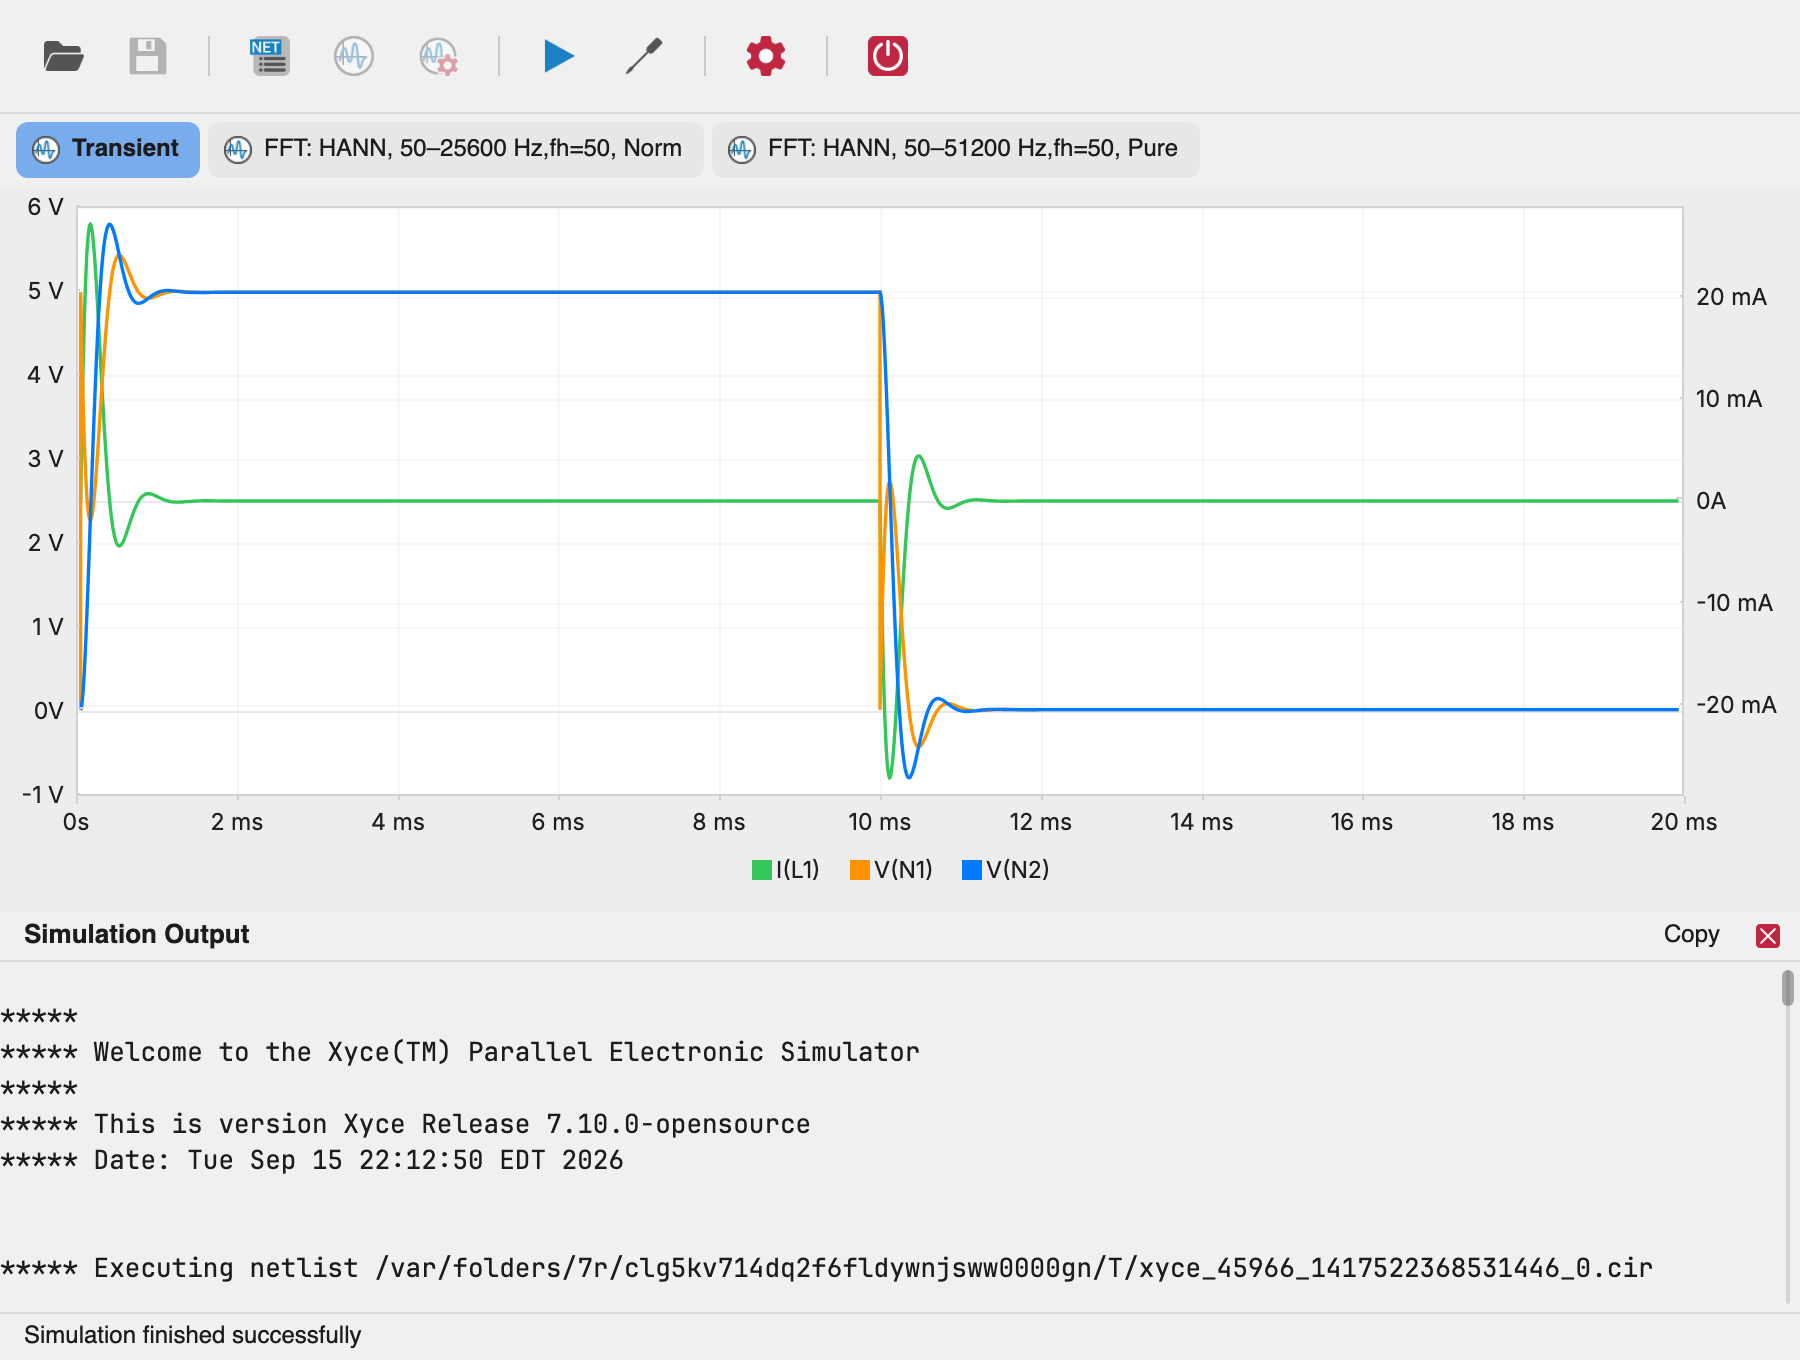
The main window has four areas:
- the toolbar at the top,
- the netlist editor in the center,
- the charts panel (shown after a simulation or when opening a
simulation output file —
.raw,.prn,.csv,.csdor.dat), and - the status bar at the bottom.
The window title shows the netlist or schematic file name. When the
netlist has unsaved edits, a * prefix appears in the title.
Toolbar
From left to right:
| Tool | Action |
|---|---|
| Open | Open a Xyce file (.cir netlist, or a simulation output: .raw, .prn, .csv, .csd, .dat). Standalone mode only. |
| Save | Save the netlist. Enabled only when the editor has unsaved changes. |
| Netlist | Show the netlist editor. |
| Charts | Show the charts panel. |
| Sim Output | Show or hide the simulation output panel. |
| Run Simulation | Run the simulation. While a simulation is running, this becomes a red Stop Simulation button that cancels the run. |
| Configure | Open the simulation parameters dialog. |
| Options | Open the Xyce options dialog to view and edit the .OPTIONS package values. |
| Plugin Settings | Open the plugin configuration dialog (Xyce executable path). |
| Exit | Close the application. |
When launched from KiCad, Open and Save are disabled — the netlist belongs to the schematic and is re-extracted on every launch.
Netlist editor
The editor shows the Xyce netlist with line numbers and syntax coloring:
component references and values, node names, and directives (.TRAN,
.PRINT, .FFT, ...) are color-coded so netlist structure is easy to
scan. It is a standard text editor — click to place the caret, drag to
select, and use the usual clipboard shortcuts.
After editing, the title is marked dirty (a * prefix appears) and the
toolbar Save tool becomes available. Saved edits persist to the
.cir file.
Simulation output panel
The Sim Output toolbar tool toggles the simulation output panel: a
monospaced log of the Xyce run, including the simulator banner, warnings,
and measurement results. It is useful for diagnosing convergence
problems and for reading .MEASURE results.
- Click a line to select it; shift-click or drag to select a range.
- Cmd/Ctrl+C copies the selection, or the whole log when nothing is selected; Cmd/Ctrl+A selects everything.
- The Copy button does the same as the keyboard shortcut.
- The panel keeps its content after being closed and reopened.
- Lines Xyce reported as a warning are amber and lines it reported as an error are red, so the reported problems stand out from the ordinary progress output.
- The header carries the
N warningsandN errorscounts whenever the run reported any. Clicking a count scrolls the log to the first occurrence and selects it.
Status bar
The status bar reports the current state: Simulation finished
successfully, Simulation failed (exit code N), Simulation canceled,
and specific errors such as Configured Xyce executable path is
invalid. While you hover the mouse over a chart, the status bar
temporarily shows a readout of the values under the cursor (see
Viewing Results).
While a simulation is running, a progress indicator appears on the right of the status bar and the message area on the left is left empty:
- a progress bar with the completion percentage and Xyce's own
estimate of the remaining time, for example
62% · ETA 14 sec.. Xyce reports progress for a transient analysis only, so a DC sweep, an AC, a harmonic balance or an operating point run shows an indeterminate bar and the elapsed time instead (9s elapsed). - the warning and error counts Xyce reported so far, colour-coded like the log lines they refer to.
- the whole status bar is a shortcut: clicking it opens the simulation output panel so you can watch the live log without leaving the view you are working in.
The percentage comes from the ***** Percent complete: markers Xyce
writes to its console log; the estimated time is Xyce's own estimate and
moves as the run learns how long a time step takes.