Viewing Results
After a successful simulation the charts panel opens automatically. You
can also switch to it with the Charts toolbar tool, or open a Xyce
simulation output file (.raw, .prn, .csv, .csd or .dat) directly in
standalone mode.
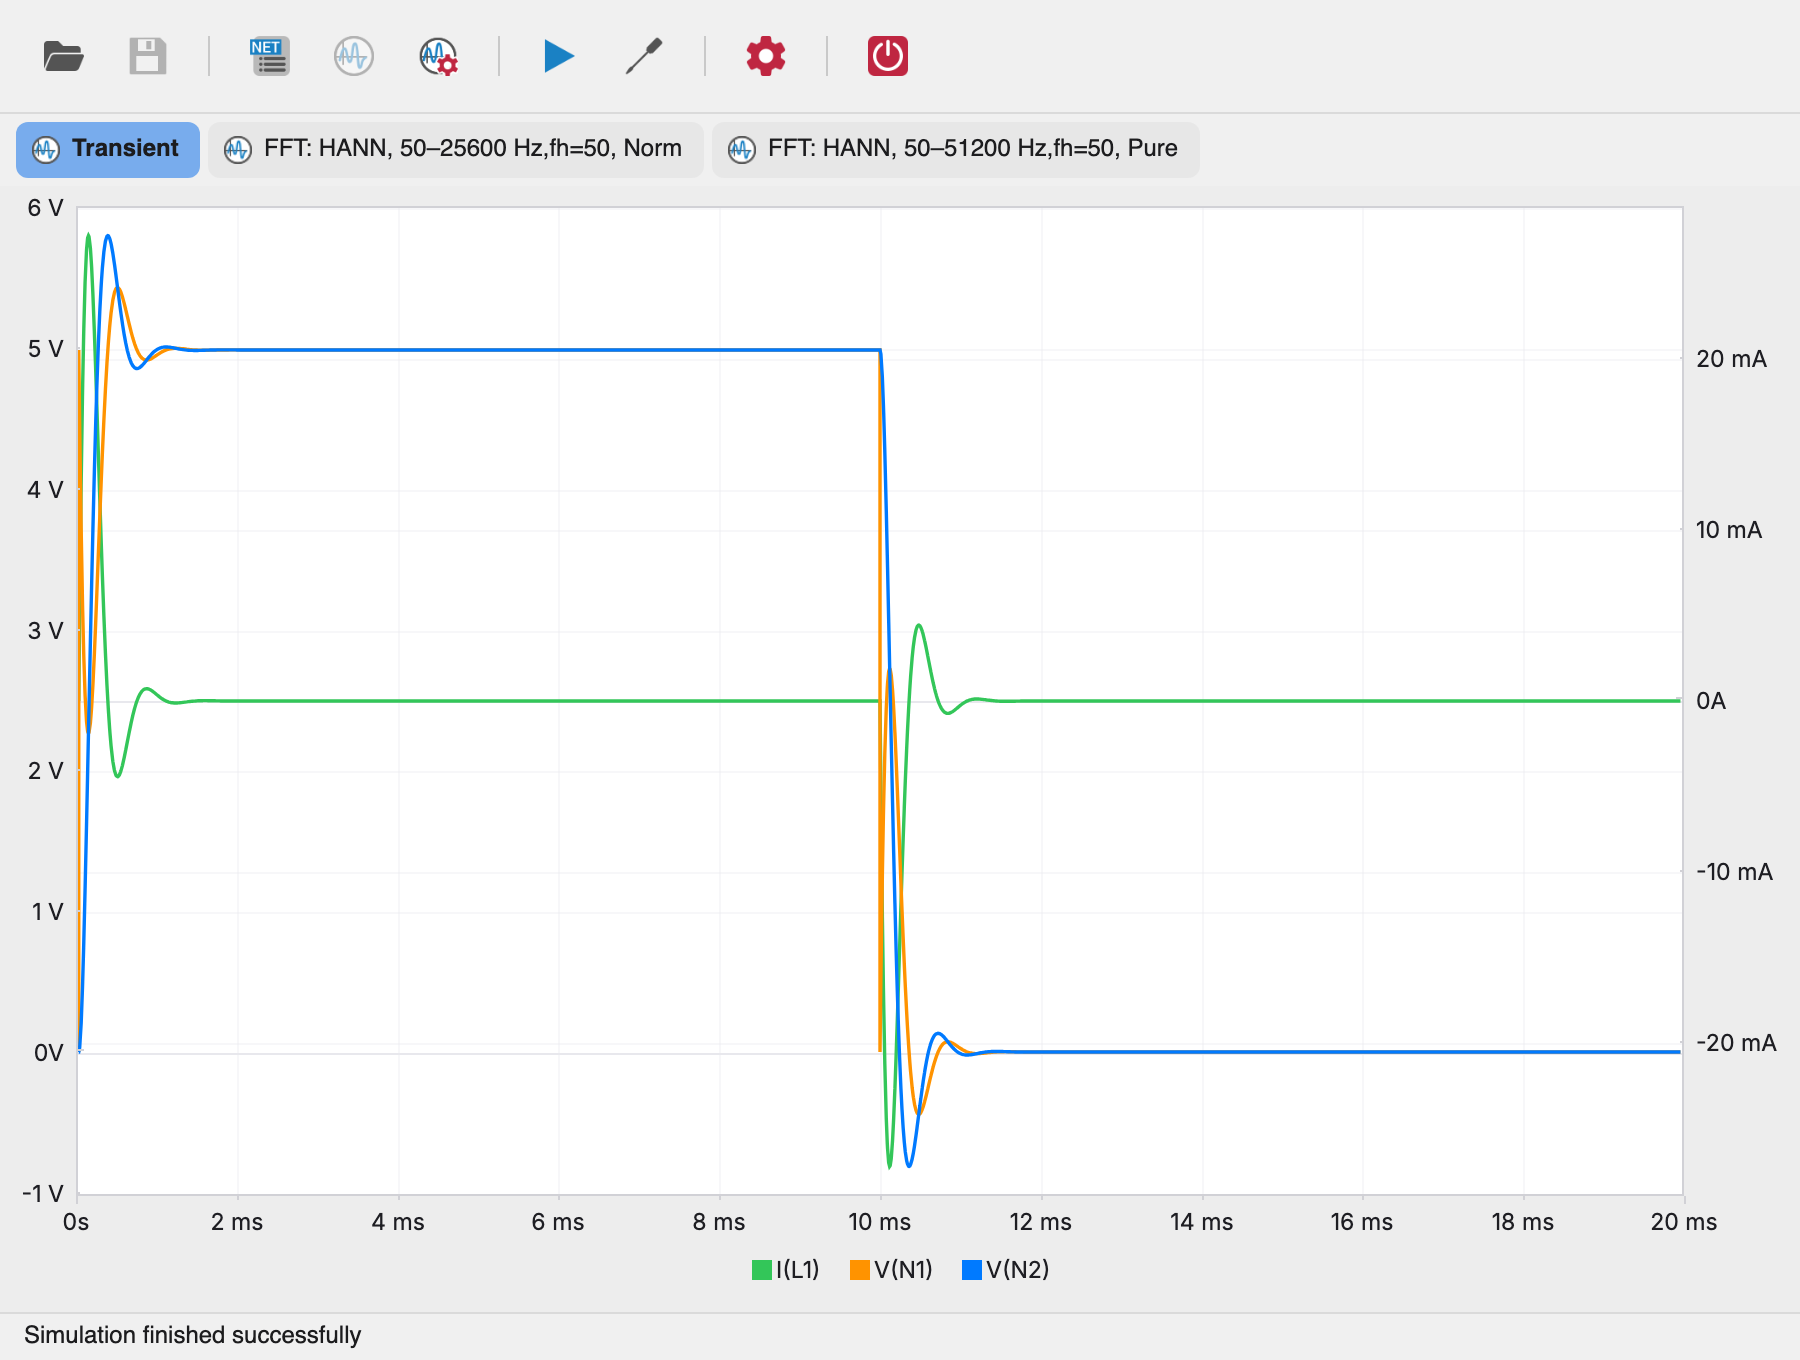
Plot tabs
Each dataset gets a tab above the plots: Transient, AC Analysis, DC Sweep, DC Operating Point, Noise Analysis — or an FFT tab named after its parameters (e.g. FFT: HANN, 50–25600 Hz…). The tab bar appears only when there is more than one dataset.
- The simulation result tab is always present and cannot be closed.
- FFT tabs you create are closable with the ✕ on the tab.
Charts and series
Each tab holds a stack of charts, drawn top to bottom. A chart starts
empty — a fresh simulation shows an empty chart until you choose the
expressions to plot, or until the netlist declares its default charts with
the .PLOT directive.
Adding and removing plots
Right-click a chart and choose Add/Remove Plots:
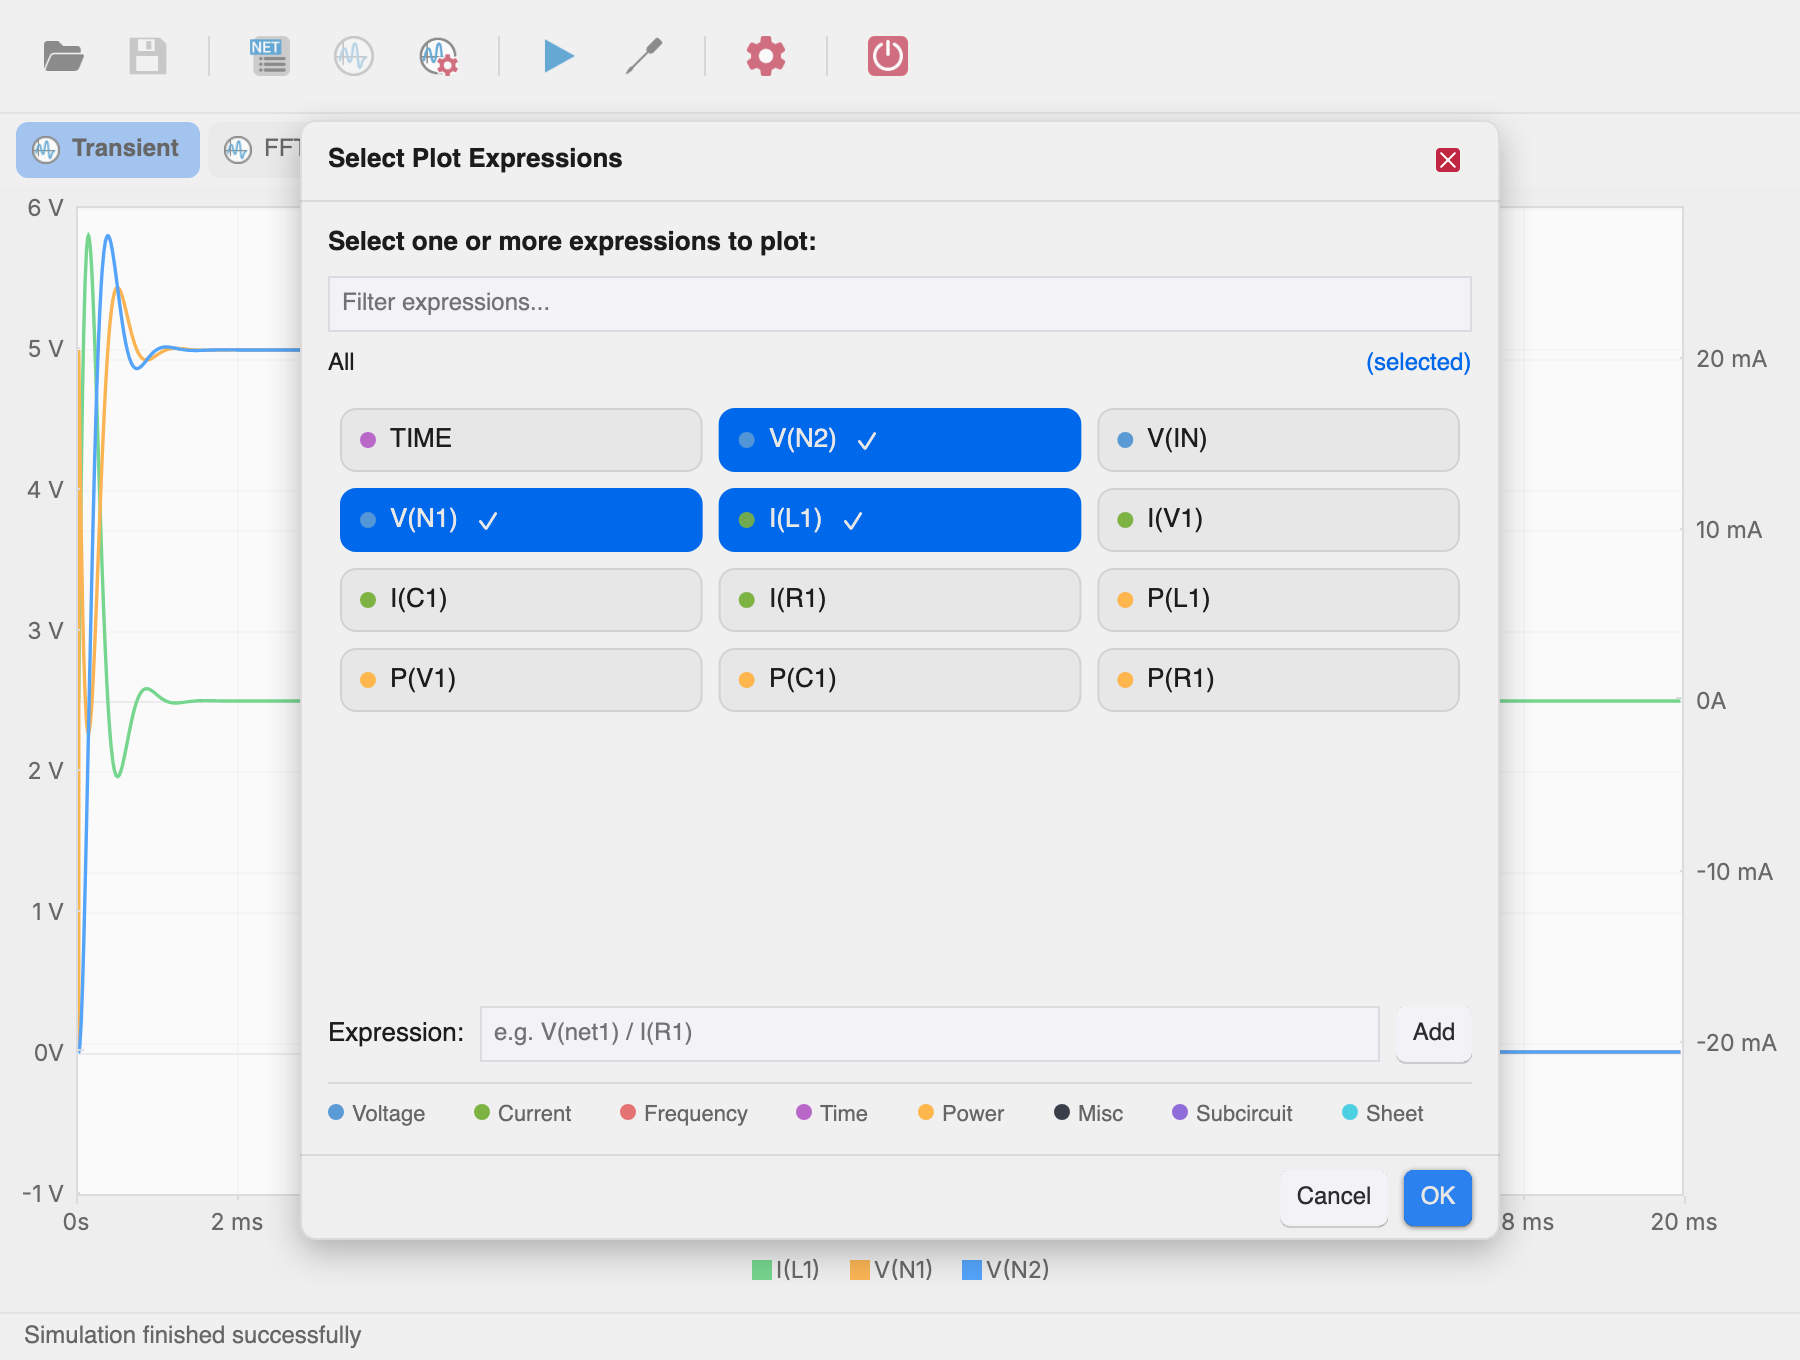
- Filter expressions... — narrows the chip grid as you type.
- Scope breadcrumb — starts at All; scope chips drill into subcircuits and sheets, each showing how many expressions it contains. The (selected) link at the right toggles back to show only selected expressions.
- Expression chips — click to toggle a series on the chart (a ✓ and accent border mark selected chips). Right-click a chip to append its name to the custom expression field.
- Custom expressions — type any expression in the Expression
field and press Add, e.g.
V(net1) / I(R1). Invalid expressions are rejected with “Invalid expression”.
Press OK to apply the selection. Every selected expression becomes a series with its own color; the legend below the chart names each series.
Series types are color-coded by signal type: voltage, current, frequency, time, power, and so on — the legend at the bottom of the dialog maps the dot colors.
Chart axes
A chart can show up to three vertical axes (stacked on the right when series of different magnitudes are combined). The horizontal axis is shared by all charts in the tab: time for transient results, frequency for AC/FFT, or the swept variable for DC sweeps.
Zooming and reading values
Hover readout
Hovering over a plot area shows a live readout in the status bar:
the abscissa value followed by the value of every plotted series, e.g.
time=1.2m V(out)=3.45.
Zoom
Drag a rectangle inside a chart to zoom. While dragging, a red selection rectangle is drawn; on release:
- the dragged chart zooms in both the horizontal and vertical range of the selection;
- all other charts in the tab adopt the horizontal range — making it easy to compare the same time or frequency window across charts.
Right-click menu zoom actions:
| Action | Effect |
|---|---|
| Zoom to Fit | Resets the full zoom window of the clicked chart (horizontal-only reset on the other charts). |
| Autorange | Resets the vertical zoom of the clicked chart only. |
| Zoom Abscissa Extent | Horizontal-only zoom reset on all charts. |
FFT of plotted signals
Right-click a chart and choose Calculate FFT on selected plots (this item appears only when the abscissa unit is time, i.e. for transient results).
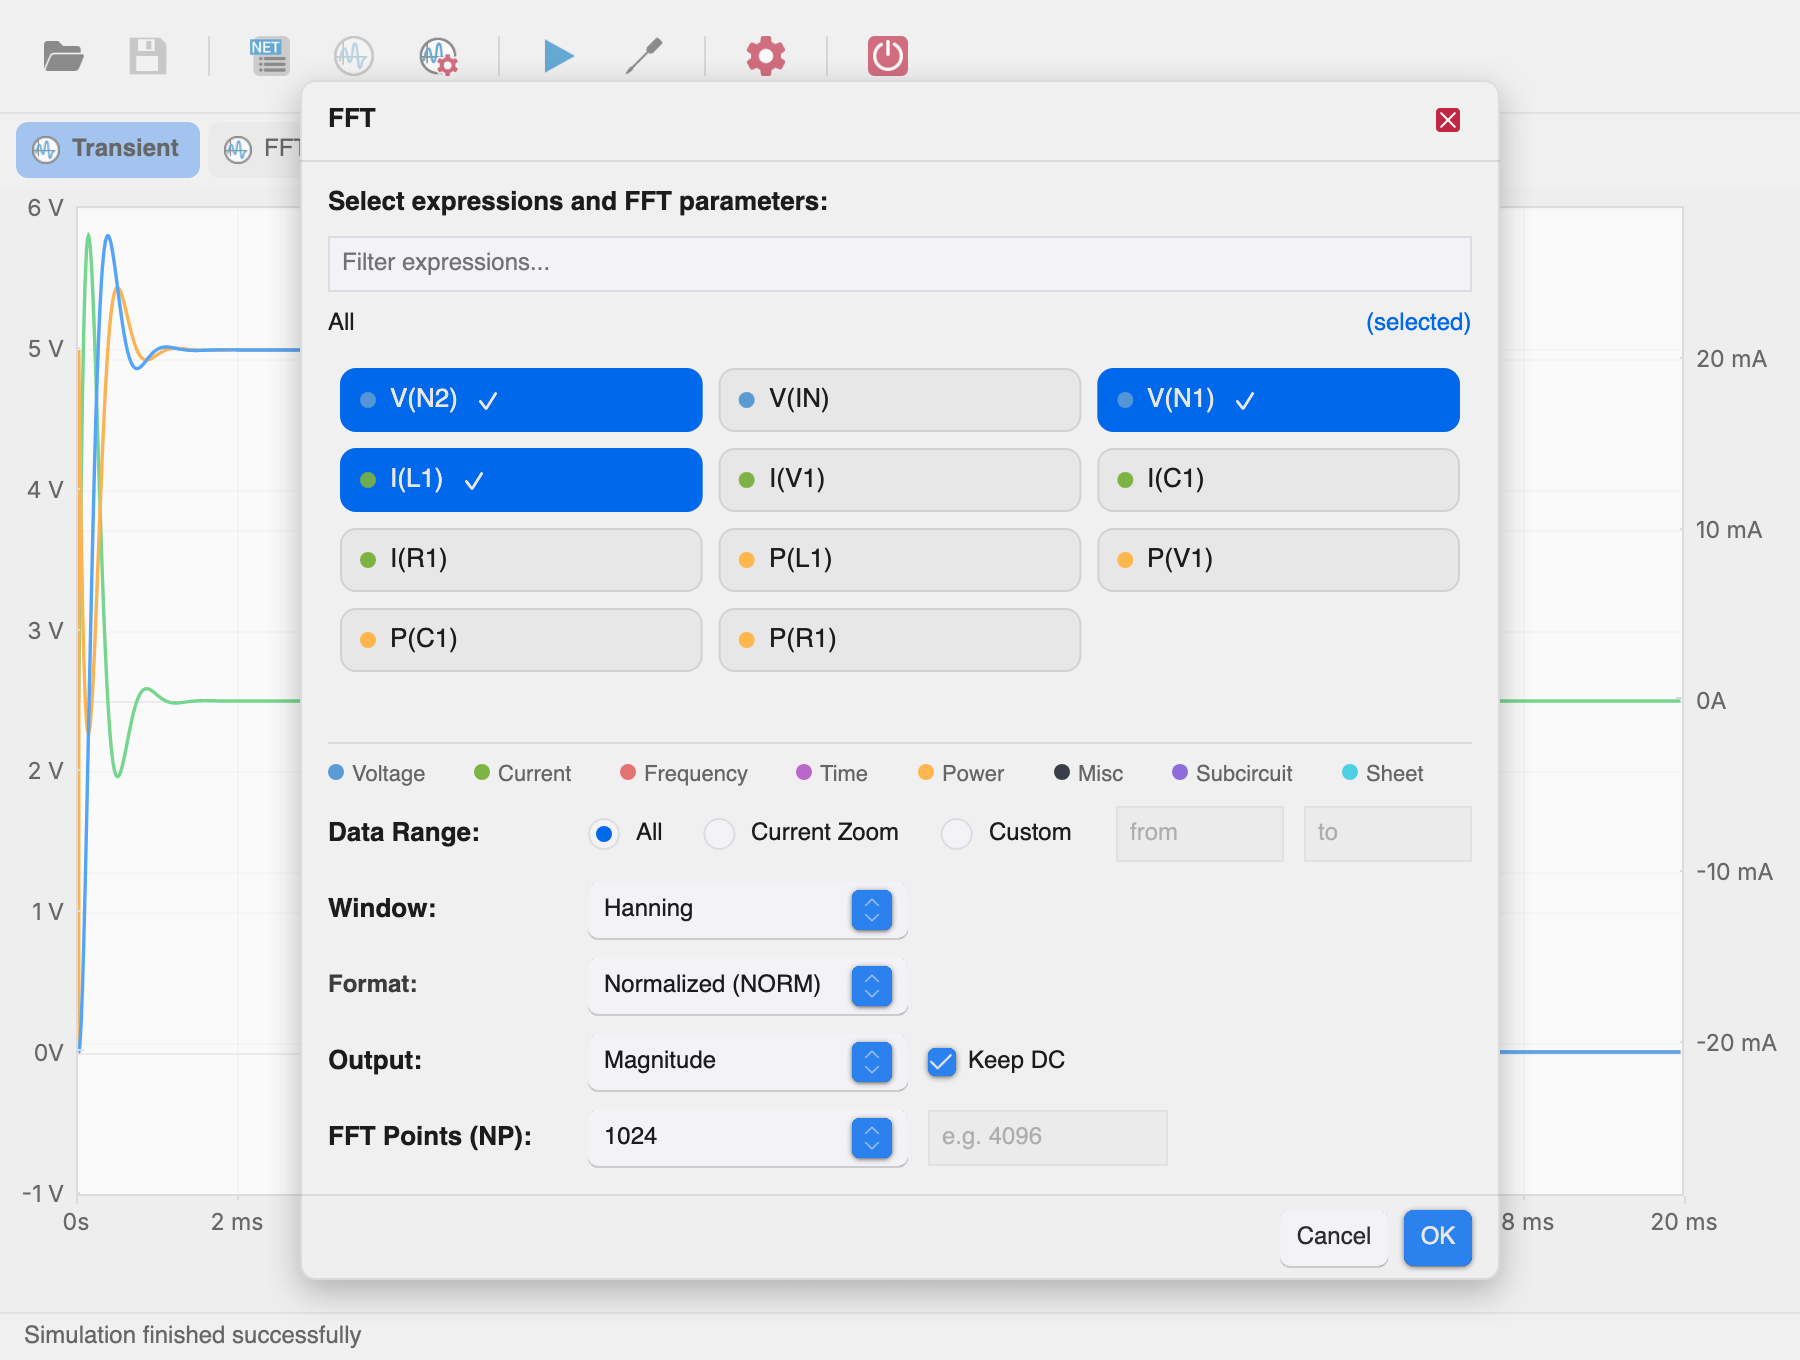
- Expressions — pick one or more real-valued signals; time expressions are not offered.
- Data Range —
All(entire record),Current Zoom(the currently visible horizontal window), orCustomwith explicit from/to values. - Window — data window applied before the transform:
Rectangular,Hamming,Hanning(default),Blackman. - Format —
Normalized (NORM)orUnnormalized (UNORM). - Output —
Magnitude(default),Magnitude (dB), orPhase. - Keep DC — include the DC component in the result (checked by default).
- FFT Points (NP) — transform length: 256 … 16384, or
Custom...(rounded to the nearest power of two, minimum 4; default 1024).
Click OK to compute. The result opens as a new FFT tab (named after the window and frequency range) with one chart per expression.
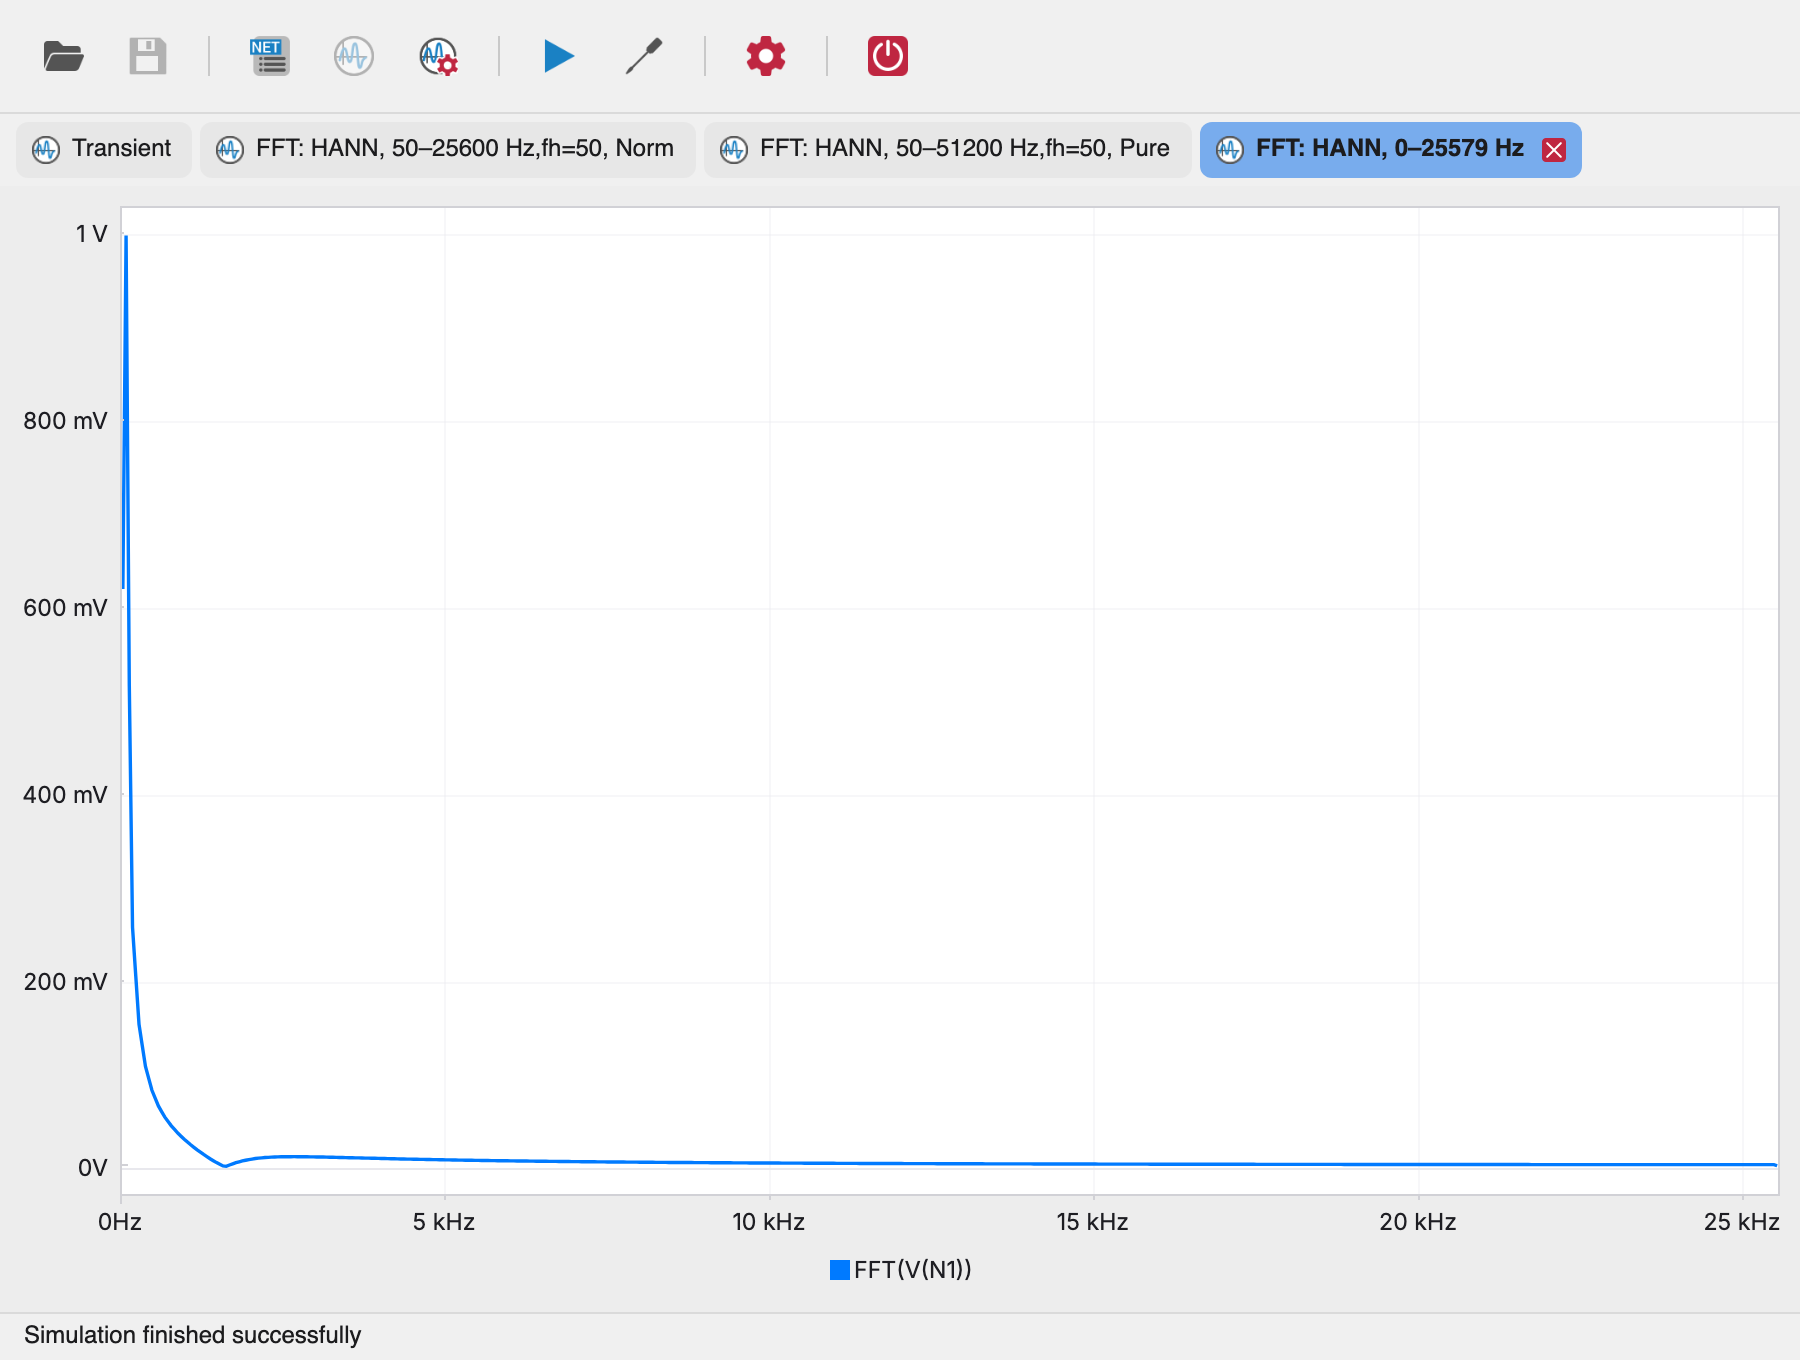
Status-bar errors: “No expressions selected for FFT”, “FFT computation skipped: no data in the selected range”, “FFT computation failed”.
Step Tool
When the netlist contains a .STEP directive, each series is computed
for every step of the sweep and drawn in the same chart.
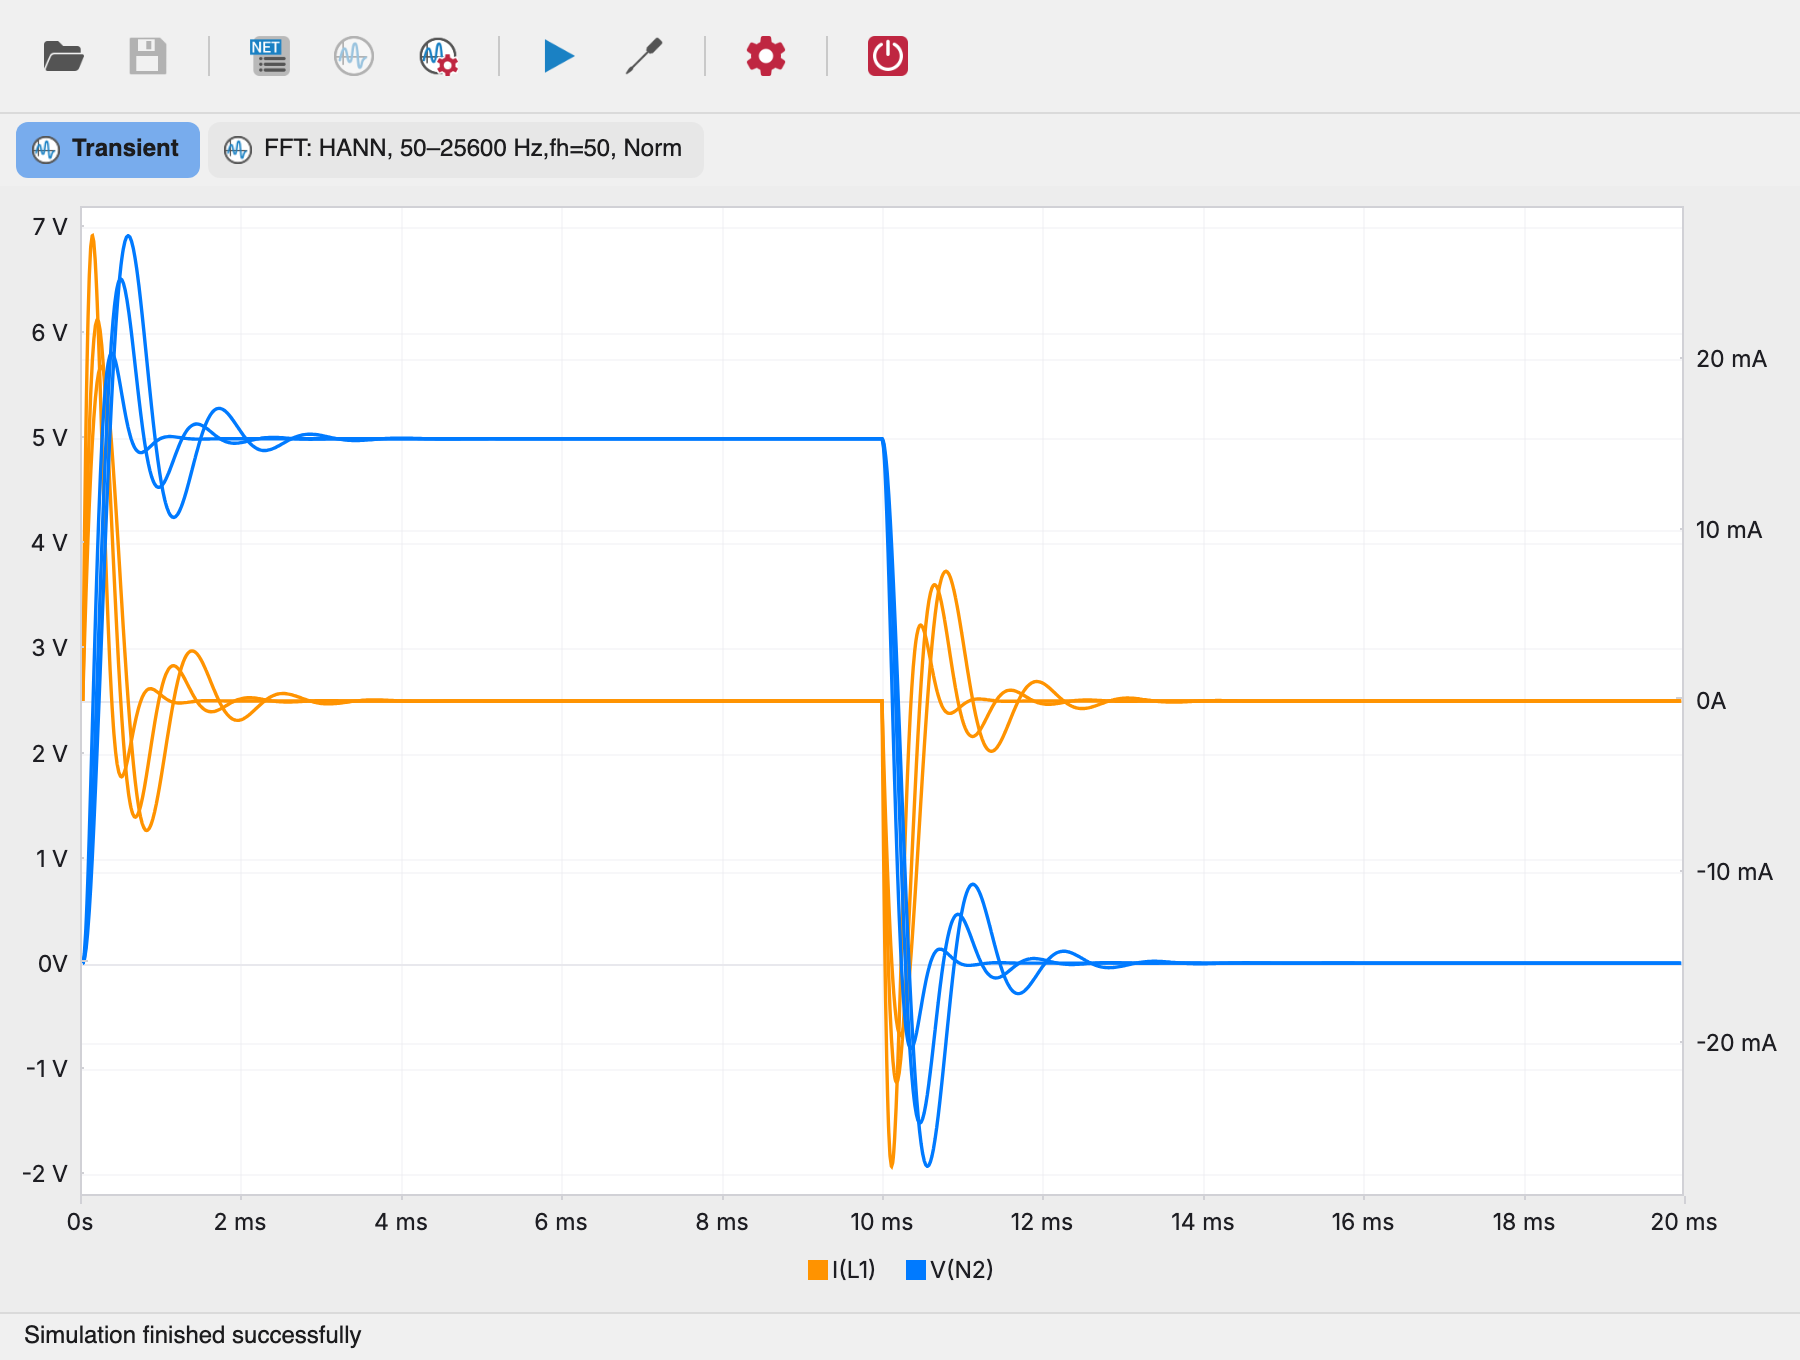
Right-click a chart and choose Step Tool... to filter which steps stay active for that chart:
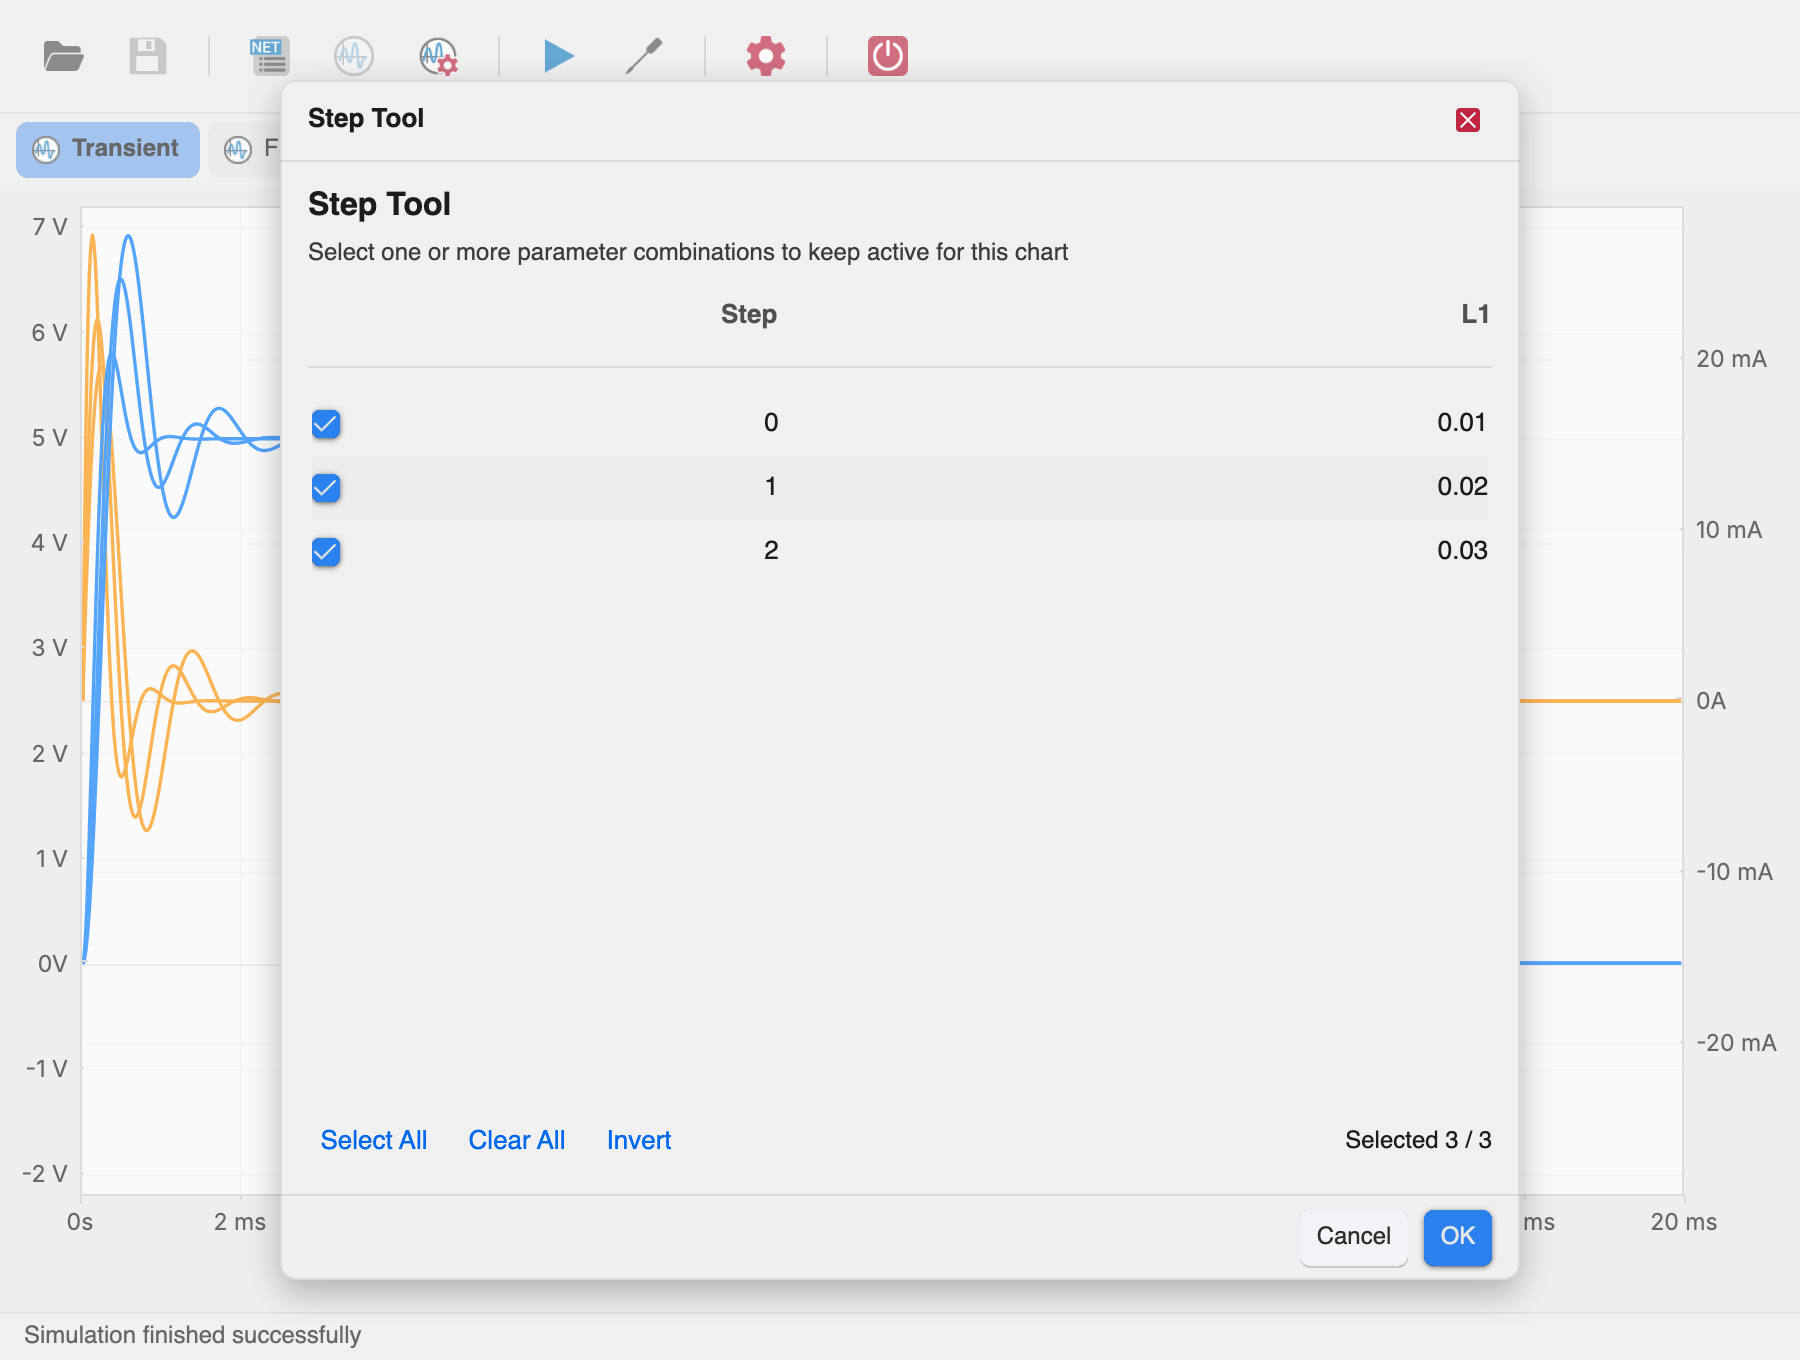
- The table lists every step with the value of each swept parameter.
- Click a row (or its checkbox) to include/exclude it.
- Select All, Clear All, Invert act on the whole table; the
footer shows
Selected N / M.
Click OK to redraw the chart with only the selected step curves.
Managing charts
All chart management lives in the right-click context menu of a chart:
| Action | Effect |
|---|---|
| Add Chart | Inserts a new empty chart directly after the clicked one. |
| Delete Chart | Removes the clicked chart (the panel always keeps at least one). |
| Delete All Plots | Clears every series of the clicked chart. |
| New Window | Opens an independent window with the same dataset — handy for comparing two zoom windows side by side. |
Charts can be reordered by dragging: grab the ☰ grip in the top-right corner of a chart and drop it between two charts — a blue drop indicator shows the insertion point while dragging.